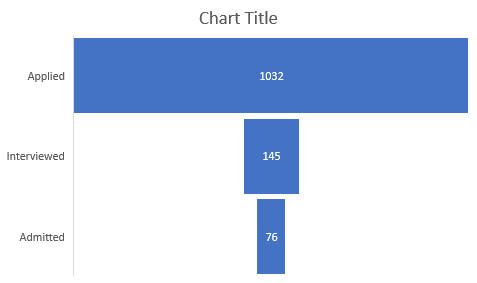
Funnel chart is used to show how the number changes over each steps. For example, below is the number of students applied, interviewed and admitted by a collage.

1. Select the data, then click Insert > Charts > Other Charts > Funnel.

2. You will get a nice looking funnel chart. It clearly shows how the number decreases from application to interview to admission.
2. You will get a nice looking funnel chart. It clearly shows how the number decreases from application to interview to admission.
Comments
Post a Comment