Posts

Showing posts from January, 2020

Excel - LOOKUP function
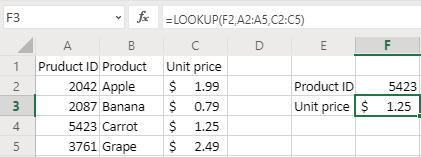
Image
If you do not know the meaning of a word, you can take out a dictionary and look up the word and get the meaning. Excel LOOKUP function does the similar thing. For example, you do not know the price associated with a product ID, you can use LOOKUP function to retrieve the price. Suppose you own a grocery store. You remember the product ID of carrot is 5423, but you do not remember the price. A LOOKUP function can help you. The formula is: =LOOKUP(F2, A2:A5, C2;C5) You enter the product ID in cell F2. It looks for the value in the data range of A2:A5, the return the corresponding value in data range C2:C5. For example, the product ID of 5423 is on row 4, the the unit price for row 4 is $1.25. Note: VLOOKUP is an improved version of LOOKUP. So use VLOOKUP instead of LOOKUP if possible.

Excel - DAYS function

Image
The DAYS function returns the difference between two days. =DAYS(C2, B2) For example, the number of days between "7/8/2019" and "1/28/2020" is 204. Internally, Excel convert date value into integers and subtract these two integers. Excel store "7/28/2019" as 43654 and store "1/28/2020" as 43858. And 43858-43654=204, giving the same result as using the DAYS function. Note: The DAYS function needs two arguments, the first one is the end date, the second one is the start date. It is counter-intuitive for many people and different from many other data software, so be very careful.

Excel - DATE function

Image
DATE function generate a date from year, month and day. For example: =DATE (A2, B2, C2) Note: 1. If the date is shown as numbers, like below, you need to format it as date. 2. Always use four digit years such as 1978 or 2020. If you use two-digit years such as 20, it may not be what you want.

Excel - MATCH function

Image
If you have a range of values, MATCH function finds the position in the range of a value given by you. For example, if you are studying a population and have age groups like below, which age group does age 16 belongs to? =MATCH(16, A2:A10, 1) The third argument 1 is the default value, and is optional. It is equivalent to the following formula in this example. =MATCH(16, A2:A10) There are 9 numbers from 0 to 80. The returned value is 3, which means the 3rd number in the list. It means age 16 belongs to the 13 to 17 age group. The row number of 13 is 4, but 13 is the 3rd number in the list, so the returned value is 3, not 4. Tip: The MATCH position only returns the relative position in a list of values, not the age group name such as "13 to 17". To return the age group name, use LOOKUP function instead. To do exact matching: The values can be in any order. But the third argument has to be 0, like below: =MATCH(16, A2:A10, 0) If the data is ordered from large to small, the third

Excel - CHOOSE function

Image
If you have a list of values, Excel CHOOSE functions returns a certain value by the index number. For example, if you have the week days from Monday to Sunday, the 2nd one is Tuesday. Note: When using CHOOSE function, you cannot select a data range such as A2:A8, you have to select the values one by one, separated by comma. The formula is: =CHOOSE(D2,A2,A3,A4,A5,A6,A7,A8) You can manually enter values instead of cell positions. For example, the following formula returns "banana". =CHOOSE(2,"apple","banana","orange")

Excel - FIND Function

Image
FIND returns the position of one text string in another text string. For example, you may want to know position of "@" in an email address. If we know position of "@" in an email address, we can further extract the domain name of an email address. Suppose you have a list of email addresses below. 1. Find position of "@" in the email address. The formula is: =FIND("@", A2) For example, "@" is the 6th character in the "alice@apple.com", so it returns a value of 6. 2. Calculate length of email address, the LEN function is used. =LEN(A2) 3. Based on length of an email address and position of "@" in it, we use MID function to extract the domain name. =MID(A2, B2+1, C2-B2) "B2+1" is the first character after the "@" sign, which is 7 in the first email address. "C2-B2" is the number of characters after the "@", which is 9 in the first email address. The MID function reads the emai

VBA Example - Calculate Sum Of Cells

Image
This example tells you how to calculate sum of values using VBA. Of course, you can achieve this by using the SUM() function without any VBA. This example demonstrates how to achieve it using VBA. Suppose you have a sales data for four regions, and you want to know the total of sales. See the data below. The VBA code is this: Sub sum_sales()     Dim row As Integer     Dim sum As Single     sum = 0     Dim sale As Single     For row = 2 To 5         sale = Cells(row, 2) 'grab cell values         sum = sum + sale     Next     Cells(6, 2) = sum 'put the calculated result in the right cell     MsgBox ("done") End Sub By running the code, you get the sum:

VBA Example - Find The Maximum Or Minimum Value

Image
Suppose you have a sales data for four regions, and you want to know the region with the highest sales. See the data below. The VBA code is this: Sub find_max()     Dim row As Integer     Dim max As Single     max = 0     Dim sale As Single     For row = 2 To 5         sale = Cells(row, 2)         If sale > max Then             max = sale         End If     Next     Cells(6, 2) = max     MsgBox ("done") End Sub By running the code, you get the maximum value: If you want to find the minimum value instead of the maximum value, the code is very similar. Sub find_min()     Dim row As Integer     Dim min As Single     min = 10000 'select a very large value     Dim sale As Single     For row = 2 To 5         sale = Cells(row, 2)         If sale < min Then             min = sale         End If     Next     Cells(6, 2) = min     MsgBox ("done") End Sub

VBA Example - Change Font Color

Image
Suppose you have a table of students scores for the math exam. Also assume the maximum possible score is 100. Therefore, any value above 100 is an error. And you want to highlight the error values in red. See the data below. The VBA code is this: 'If a score>100, it is an error. Mark it in red. Sub Change_color()     Dim row As Integer     Dim score As Integer     For row = 2 To 16         score = Cells(row, 2)         If score > 100 Then             Cells(row, 2).Font.Color = RGB(255, 0, 0)         End If     Next     MsgBox ("done") End Sub The RGB() function is the function that Excel uses to set colors. RGB(255, 0, 0) is for red. By running the code, you get the maximum value:

VBA example - Generating Random Numbers

Image
If you are conducting a randomized clinical trial, you need to assign patients randomly into the "treatment group" and "control group". It can be achieved by the following code. 'generate random numbers, and put 'patients in different groups based 'on the random number Sub RandomNumber()     Dim row As Integer     Dim r As Single     For row = 2 To 17         r = Rnd()         Cells(row, 2) = r         Dim group As String         If r < 0.5 Then             group = "Treatment group"         Else             group = "Control group"         End If         Cells(row, 3) = group     Next     MsgBox ("done") End Sub The result is below.

VBA Example - Generate an Excel table

Image
Suppose you want to make a table of sales of your company in each regions in Quarter 1 and 2, like below. This code will achieve it. Sub Make_table()     Sheets("Sheet1").Cells(1, 1) = "Region"     Sheets("Sheet1").Cells(2, 1) = "East"     Sheets("Sheet1").Cells(3, 1) = "West"     Sheets("Sheet1").Cells(4, 1) = "South"     Sheets("Sheet1").Cells(5, 1) = "North"     Sheets("Sheet1").Cells(1, 2) = "Quarter 1"     Sheets("Sheet1").Cells(1, 3) = "Quarter 2"     Sheets("Sheet1").Cells(2, 2) = 52     Sheets("Sheet1").Cells(3, 2) = 47     Sheets("Sheet1").Cells(4, 2) = 68     Sheets("Sheet1").Cells(5, 3) = 75     Sheets("Sheet1").Cells(2, 3) = 89     Sheets("Sheet1").Cells(3, 3) = 65     Sheets("Sheet1").Cells(4, 3) = 79     Sheets("Sheet1").Cells(5, 3) = 100     MsgBox ("

Excel - IF function

Image
If function is a logic function. It does two things: Whether the criteria is met Return a value based on whether the criteria is met or not. If the criteria is met, it returns one value; if the criteria is not met, it returns a different value. The reason IF function is confusing for some Excel users is that it does two things: a logical test, AND a return value depending on the logical test result, while the name of "IF" implies it only does a logical test. If this function only returns TRUE or False, it would be much easier to understand. In the following example, there are 5 employees, each having his own budget. Column C records the exact amount of money they spent. If the actual spending is greater than budget, we call it "Over budget", otherwise, we call it "Within budget". The IF function is: =IF(C2>B2,"Over budget","Within budget") The first part, "C2>B2", is a logical test. If this is TRUE, then the IF function

Excel - Automatic calculation

Image
Excel has a feature that can automatic shows aggregate statistics about your data, no code or formula is needed. You do not even need to click a button! For example, I have data below. If I select the data range, aggregate statistics automatically show at the end of the Excel window. By default, it shows average, count and sum. However, if you click on the little down arrow to the right of "Sum" (in red circle in the picture below), you can customize which statistics to show.

Excel - Conditional formatting

Image
You can format Excel cells based on their values, which is called conditional formatting. Suppose we have the scores of 5 students in each subject. 1. Click Home >  Conditional Formatting. 2. Select Highlight Cells Rules > Text that Contains, a window pops up. We want to format cells that contains the text "A" in a special format, so we fill "A", and click OK. 3. Now the cells with "A" have light red fill with dark red text. 4. If you want to remove the formatting, you can use clear format

Excel - Clear format or content

Image
You can easily clear the format, content, or both in Excel. Suppose you have a table like below. But now you do not like the format, what can you do? 1. Select the data range that you want to clear. Then click Home > Clear , select Clear Formats 2. Then, all the formats are gone. What you see is the plain Excel content. 3. If you click Clear Content , all the content is gone. This function is same as pressing the " Delete " button on the keyboard. Learn format table by cell values using conditional formatting

Excel - Format as table

Image
You can easily format raw Excel data as a nicely looking table, using the "Format as Table" tool. Suppose the following is our raw data, which shows scores of 5 students in each subject. 1. Click Home > Format as Table , and select your favorite style. 2. Select the data range. Remember to check " My table has headers " since our data does have headers. 3. Click OK , and you see a nicely looking table. It not only has alternate colors in rows, but also has header filters, which you can use to filter data. 4. Click on the "Math" column, you will see the available values.

Excel - Consolidate

Image
If you have several data sources but the data structure is more or less same. Then you can use "Consolidate" tool to merge multiple data sources into one. Now imagine you own 3 stores, which sells more or less same items, and you have the quarterly sales data for the last year. Data of Store 1: Data of Store 2: Data of Store 3: Notice that the column headers are same, however, the row headers are not same across the 3 stores. 1. Open all the 3 workbooks containing the sales data of 3 stores. 2. Open a new workbook. Then Click Data > Consolidate Note: If data of the 3 stores are in separate worksheets of the same workbook, then you can just work in this Workbook. No need to create a new workbook. 3. Select "Sum" since we want to add up the sales amount 4. In the "Reference" field, go to the workbook and select the data range, then click "Add". Do it for store 1, 2 and 3. Check "Top row" and "Left column". This makes sure tha

Excel - Text to columns

Image
Suppose you have already enter some text data into Excel such as names. But later you think you rather having a full name field, you would rather have first name and last name separated. Instead of entering everything again, a handy Excel data tool can help you. That is, the "Text to Columns" tool. 1. Suppose you have data below.  2. Highlight the data you want to process. Then click Data > Text to Columns 3. A dialog window pops up. Select "Delimited". 4. Select "Space". If your data is separated by comma instead of space, you should choose "Comma" instead. 5. In the destination, select the cell where you want the newly split data to be placed. We strongly recommend you choose an empty cell so the original data are not covered and replaced. Then click Finish . 6. Now the full name is split into first name and last name.

Excel - Get geographic data automatically

Image
Excel now has a new function that allows you retrieve geographic data automatically. You can retrieve stock price data automatically in a similar way. 1. Enter a list of locations. In this tutorial, I entered two countries, one US state, one US county, and one US city. 2. Highlight the data rows and click Data then Geography . Do NOT select the header. You need latest version of Excel or the free web version of Excel to do this. 3. After a few seconds, Excel finds the matching geographic locations for your list. 4. Click on the symbol resembling a little drawer in red circle in the above picture. I selected Area , Population , and GDP . Notice the #FIELD! error for the last three rows. It is because the GDP data is not available for these 3 geographic locations. 5. Be careful with the results. Excel does the matching automatically. However, it may not match everything correctly. For example, I have difficulty matching Canada when it is mixed with some US states, counties and cities.