Similar to treemap chart, sunburst chart is also used to show hierarchical data. For example, suppose you run a factory and your products are sold all around the world. The following shows your market and number of machines sold in each market.

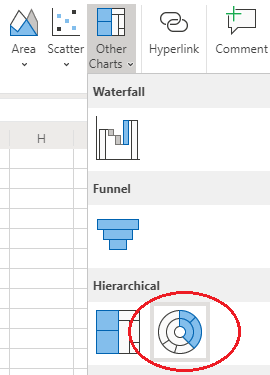

1. Select the data. Click Insert > Charts > Other Charts. Under Hierarchical, select Sunburst.
2. Now you get a sunburst chart. The inner most circle shows the highest level of data, while the outer most circle shows the finest level of data.
Comments
Post a Comment