This tutorial teaches you how to make pie chart in Google Sheets. In Google Sheets, donut chart is regarded as a special type of pie chart (pie with a hole). So, this tutorial is also on how to make a donut chart.
Suppose you run a grocery store and record the sales of items. The data is below:

1. Select the data.


Suppose you run a grocery store and record the sales of items. The data is below:
1. Select the data.
2. On the menu, click Insert > Chart. A pie chart pops up automatically. Unlike Excel, Google Sheets are "smart". It tries to understand your data and select the most appropriate type of charts according to its understanding.
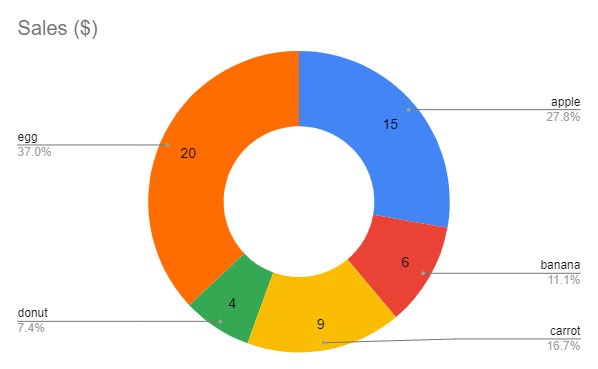
3. The percentages of sale volume for each item is already shown. Suppose we want it to display the dollar value as well. Right click the chart, then click Chart style.

4. Under Pie chart, we change Donut hole to 50%, and under Slice label, select value.
5. Now you get a pretty donut chart. If you set the donut hole to 0% in the last step, you will get a solid pie chart instead.
Comments
Post a Comment