
Google Sheets - Tree map chart

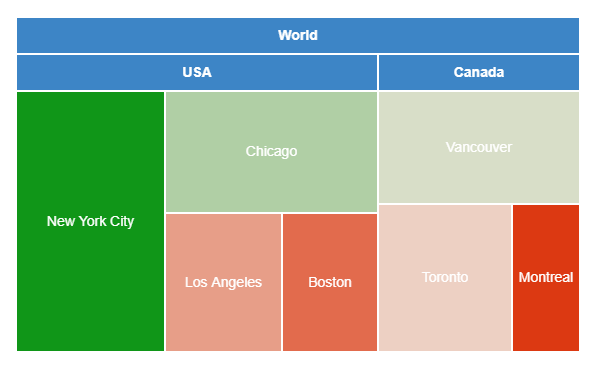
Tree map chart uses rectangles to show the data of each component in a hierarchical way. For example, suppose a company sells its products to USA and Canada market. In USA, the clients are in New York City and Chicago etc. In Canada, the clients are in Vancouver and Montreal etc. Like below:

To make tree map chart, you should have at least 3 columns of data. You can read the data this way: USA is part of World, New York City is part of World, Canada is part of World, Vancouver is part of Canada etc. In the first row, World is the top level, so cell B1 is blank. The third column is the number of items sold in each region, which is used as size of each rectangle in the tree map chart.

When making tree map chart, the order of columns are very strict. However, the order of rows does not matter. You can rearrange the rows in a different way but the tree map chart does not change.


1. Select the data. Click Insert > Charts. Under Chart type, select Tree map chart.


2. Now you get a pretty tree map chart. It is easily tell the hierarchical structure and the size of each market.
 

Comments

Popular posts from this blog

Excel - Solver examples

Excel Solver is used to solve optimization problems, which is like solving equations. In this tutorial, we will give a very simple example on how to use Excel Solver. Basic example Suppose your car is low on gasoline. The gasoline is $3/gallon. You have a budget of $50. How much gasoline can you buy? Of course, for a problem this simple, we do not even need a Solver to solve the problem. However, the purpose is to teach the users how to use Excel Solver, so we make the problem extremely simple. We have the following framework: Goal: maximize quantity of gasoline Relationship: cost=quantity * unit price Constraint: cost<=budget 1. In cell B1, we enter unit price "3", in cell B4, we enter the budget 50. In cell B2, we just enter an arbitrary number as the number of gallons. We entered 5. In cell B3, we enter the formula "=B1*B2" to let it be the cost, which equals to 15. 2. Click Solver under the Data menu. 3. A Solver dialog window pops up. In "Set objective...

Why Your Excel Formula Isn’t Working (And How to Fix It)

You type a formula into Excel, press Enter… and instead of the result you expect, you get an error, a zero, or something that just looks wrong. If this sounds familiar, you’re not alone. Excel formulas “not working” is one of the most common frustrations for Excel users — from beginners to experienced professionals. The good news? In most cases, the problem is caused by a small, fixable issue , not a broken spreadsheet. In this article, we’ll cover the most common reasons Excel formulas fail and show you how to fix them. 1. The Cell Is Formatted as Text This is by far the most common issue. Symptoms: Excel shows the formula instead of the result You see something like =SUM(A1:A10) in the cell Why it happens: The cell (or column) is formatted as Text , so Excel treats the formula as plain text instead of calculating it. How to fix it: Select the cell or column Go to Home → Number Format Change Text to General Click into the cell and press ...

Excel - How to count the number of sign changes (from + to - or vice versa) in a column?

Suppose you have a column of numbers and the data can be positive or negative. How do you count the number of times the data changes from positive to negative, or vice versa? We will use three functions, SIGN , INT and SUM to solve the problem. First we add a helper column B, name it "sign", then use SIGN function to get its sign. If the data is positive, it returns 1. If the value is negative, it returns -1. The formula is like: =SIGN(A2) Then we add another helper column C, call it "sign change", which checks whether sign of the current value is different from the last value. INT function is used to return the logical value TRUE or FALSE into 1 or 0. At last, at the end of column C, we use a SUM function to sum all the value changes. In this example, the data sign changes for 4 times (-1 to -3, -3 to 4, 2 to -5, and -5 to 6). VBA method Below is the VBA code to achieve it. You need to add a clickable button on the spreadsheet and assign the following code t...